BeverageIQ Consulting LLC

The Profitability
Audit

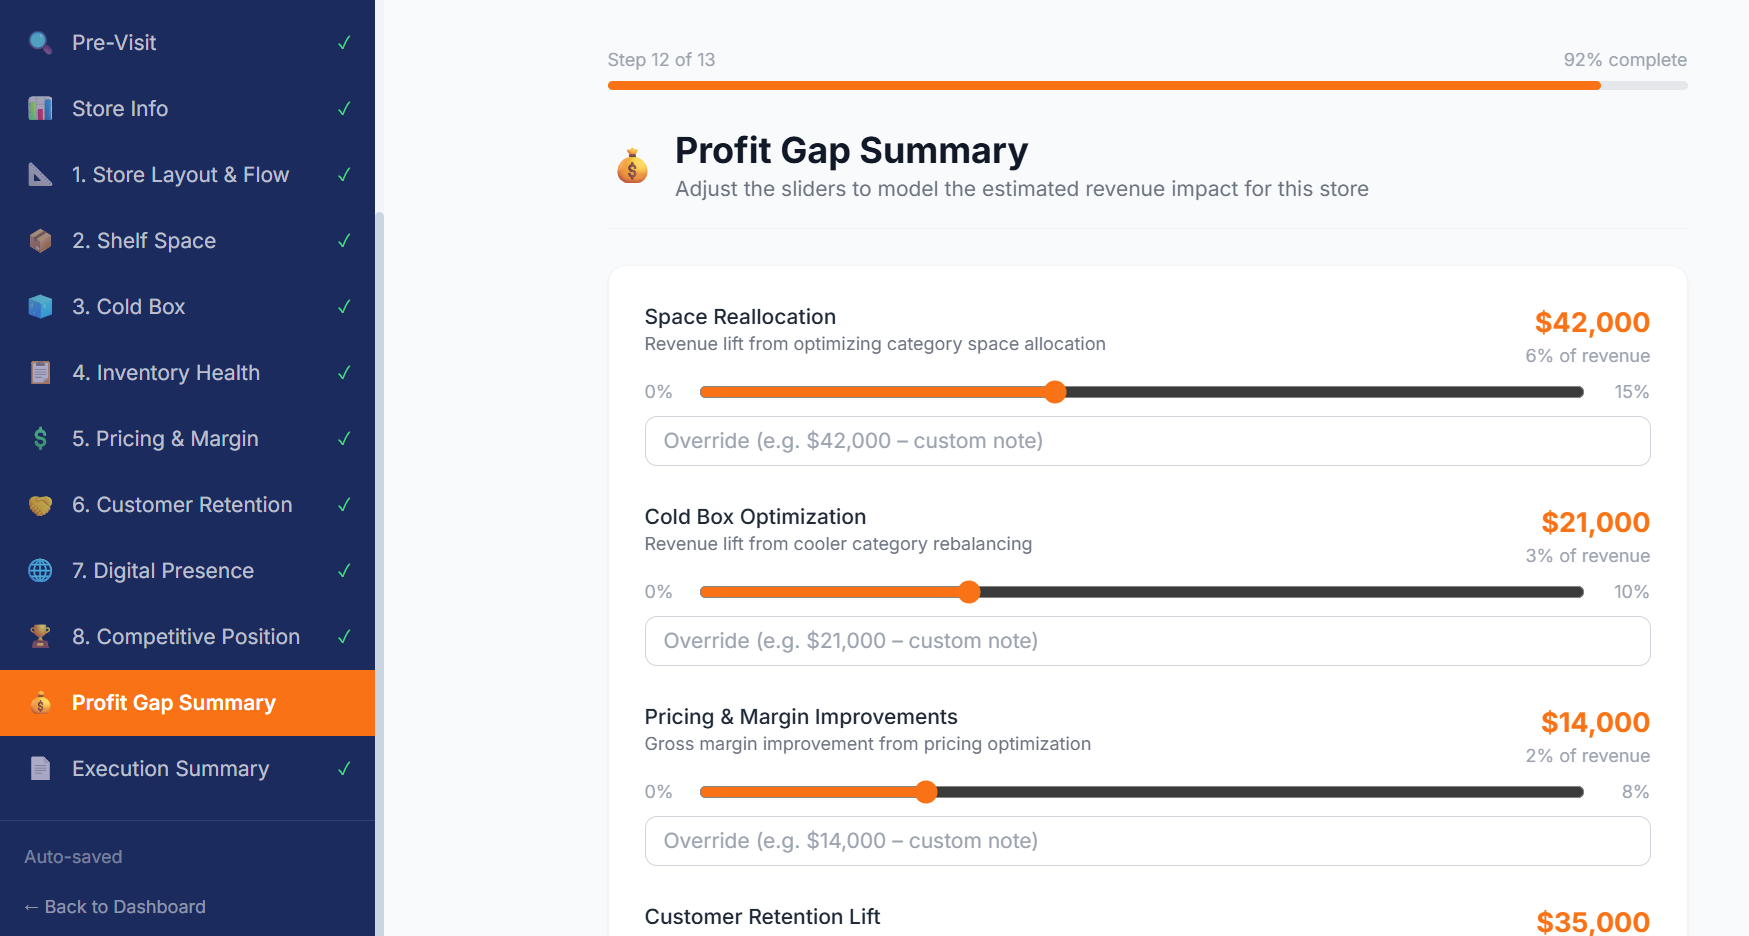
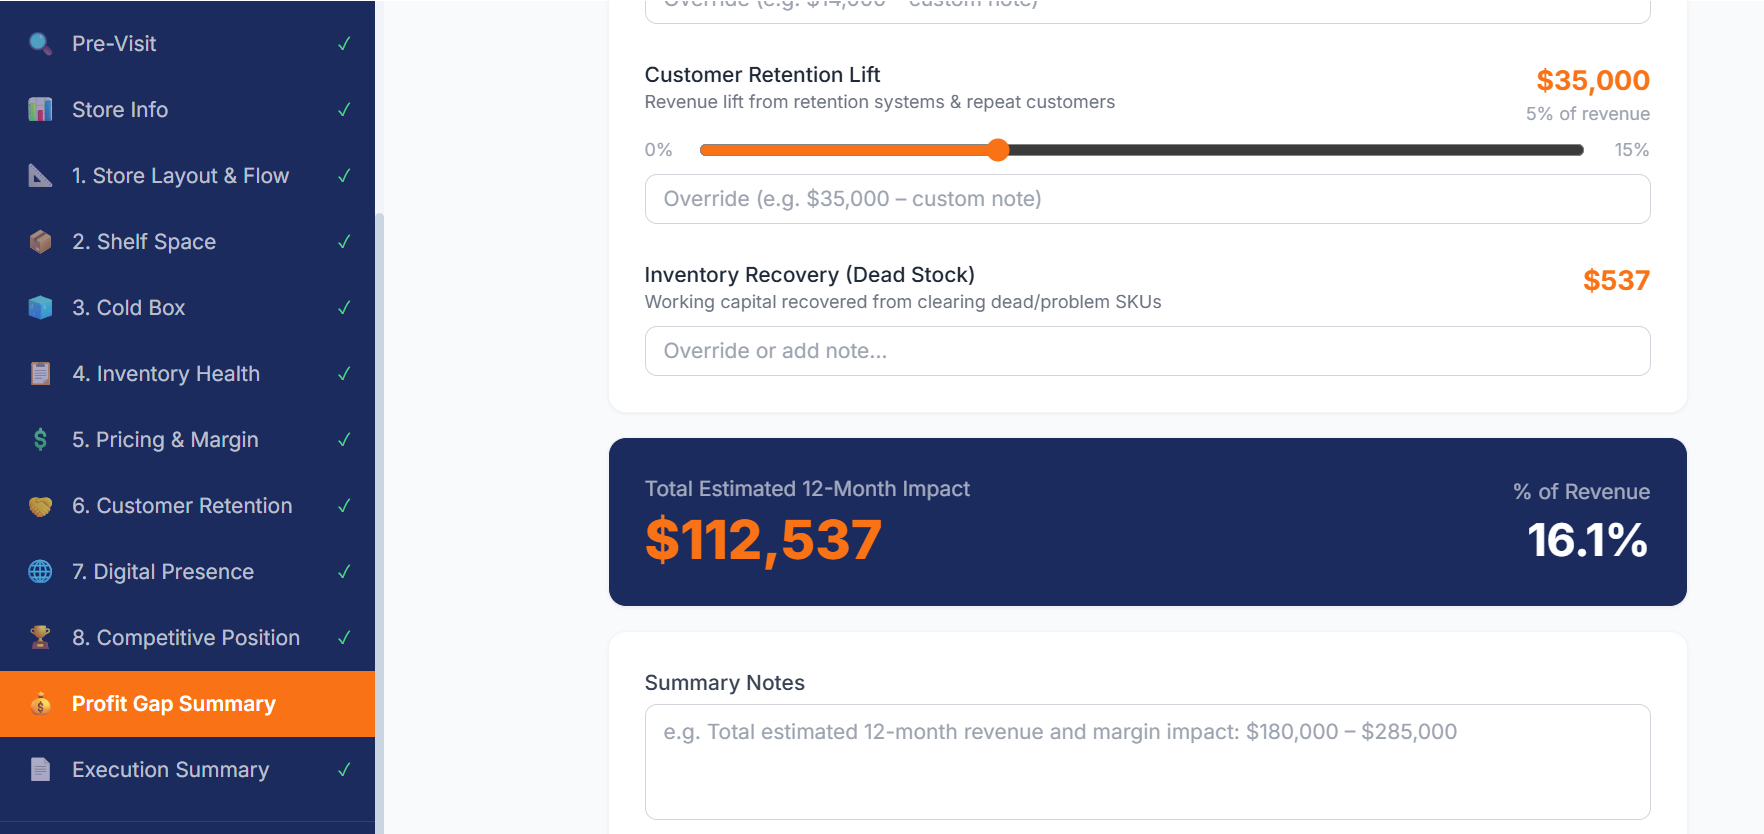
A structured, data-driven analysis that finds the revenue your store is leaving on the table — and a clear plan to capture it.

ELEVATE YOUR BUSINESS
BeverageIQ Consulting LLC  ·  Tampa, FL
The Challenge

Independent Stores Are Flying Blind

Chains have data science teams. You have gut instinct. We close that gap.

📦

Dead Inventory Traps Cash

Slow-moving SKUs tie up working capital that could be reinvested in high-velocity products.

📐

Space Doesn't Match Sales

Top-selling categories routinely get less shelf space than they deserve — costing revenue every day.

💲

Pricing Leaves Margin Behind

Without a structured pricing strategy, stores undercharge on premium products and miss margin opportunities.

🔄

Customers Don't Come Back

Most stores have no loyalty system, no contact database, and no planned promotions to drive repeat business.

Real Example — $700K Annual Revenue Store
$112,537
Identified in a Single Audit Visit
16.1% of annual revenue — left on the table every year
Space reallocation · Cold box optimization · Pricing improvements · Customer retention lift · Inventory cash recovery
Our Solution

The BeverageIQ Profitability Audit

A structured, on-site analysis that scores your store across 8 categories, quantifies the revenue gap, and delivers a 90-day action plan.

1

Store Layout & Flow

2

Shelf Space

3

Cold Box

4

Inventory Health

5

Pricing & Margin

6

Customer Retention

7

Digital Presence

8

Competitive Position

Purpose-Built Software

Conducted In a Dedicated Audit Platform

Every audit is completed inside our proprietary tool — structured, consistent, and instantly shareable.

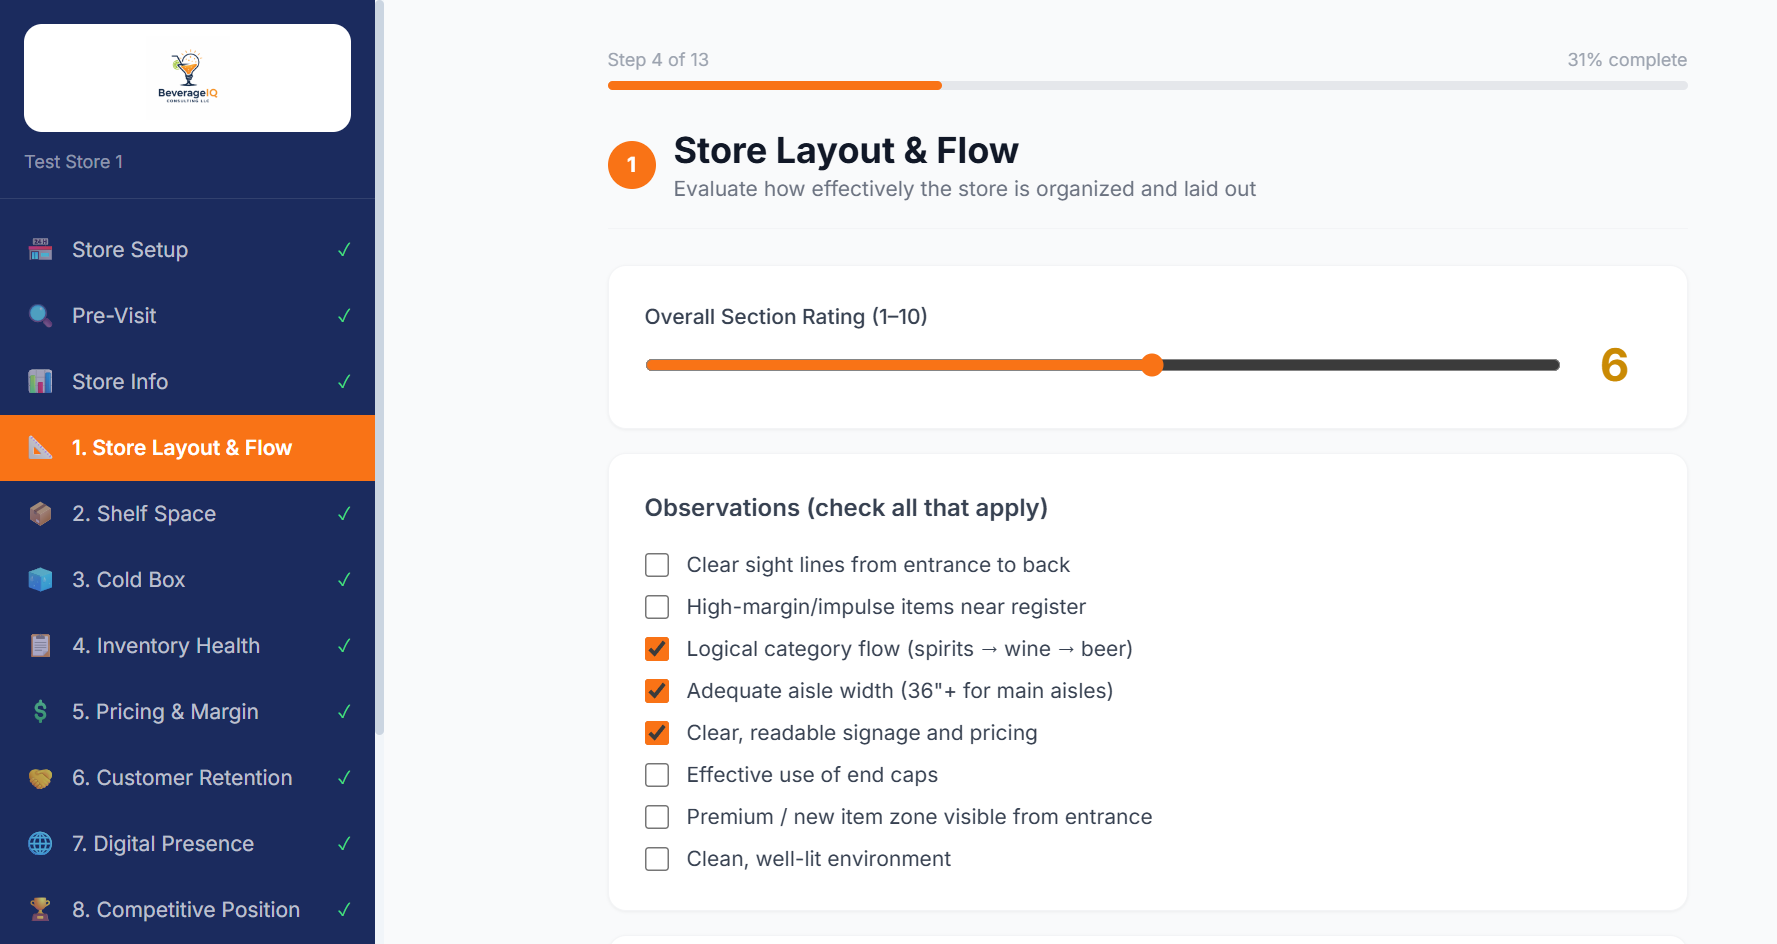
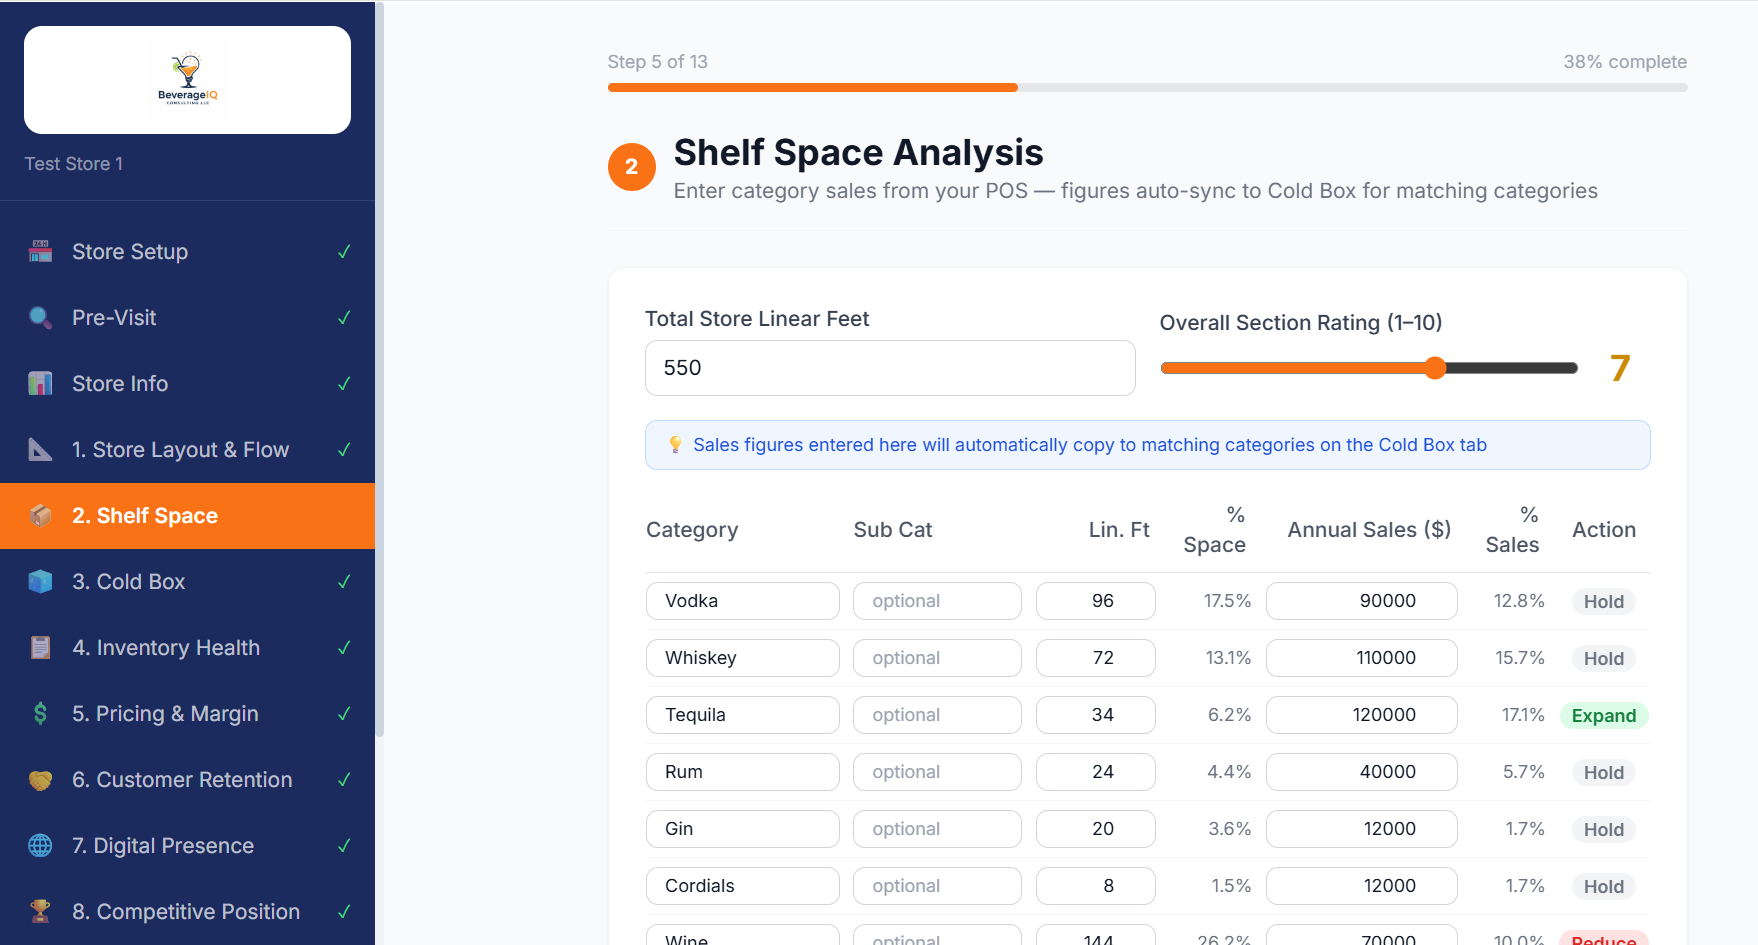
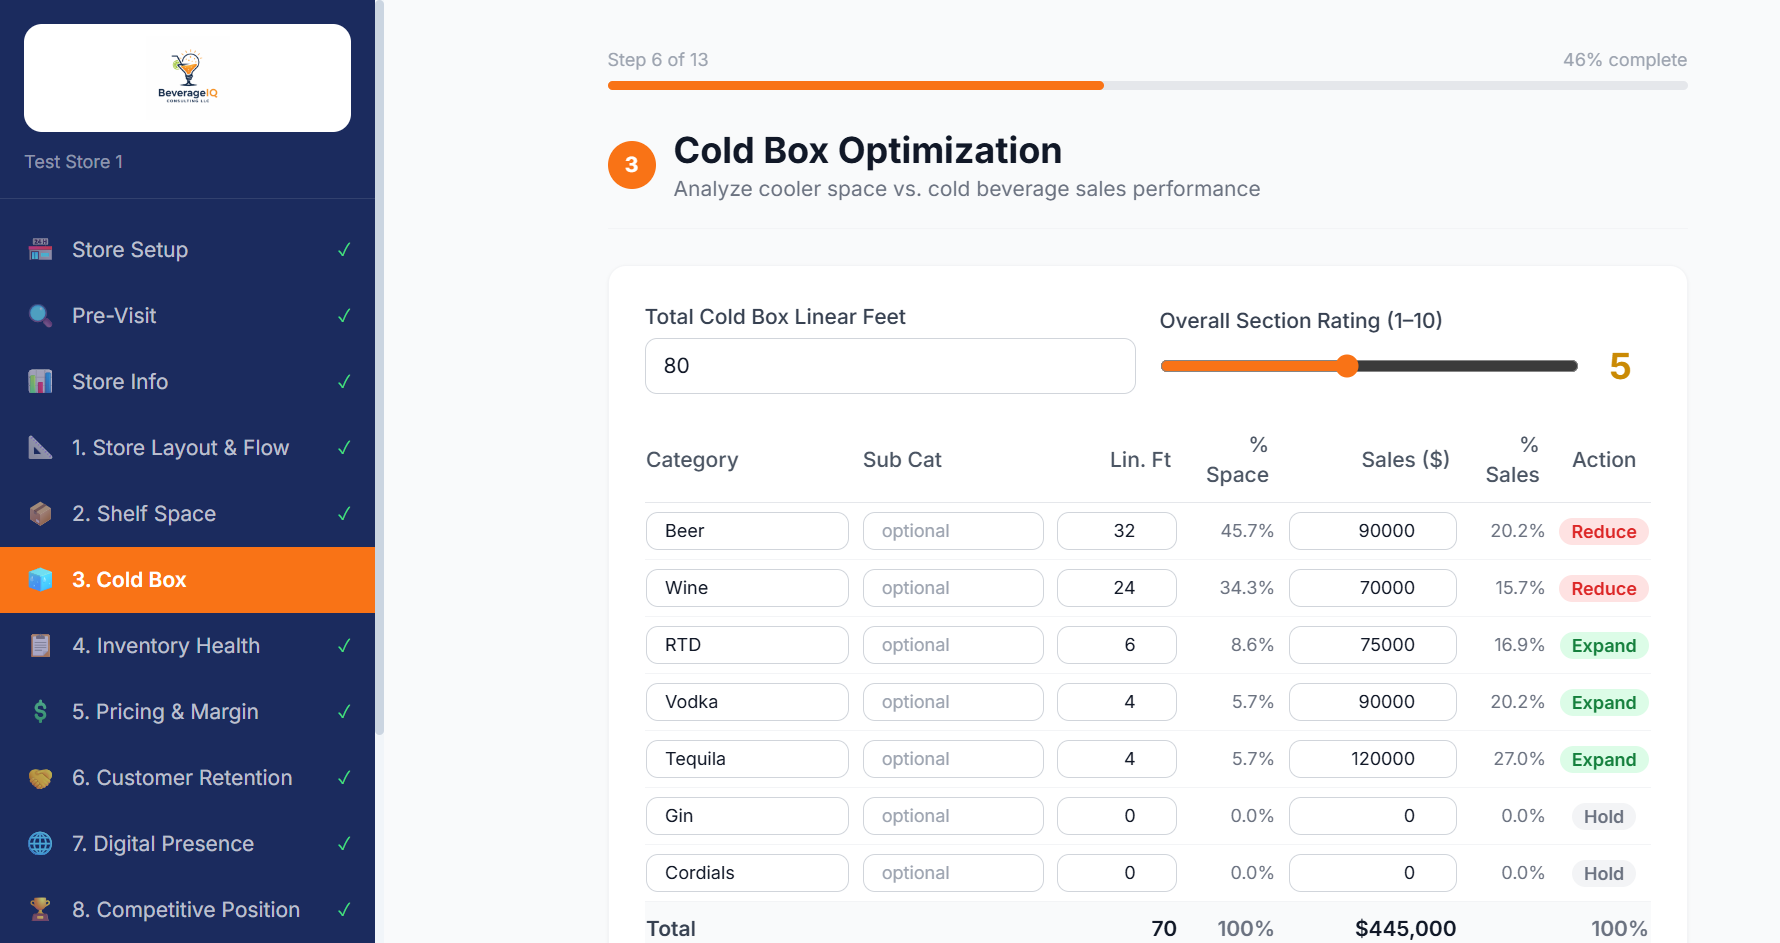
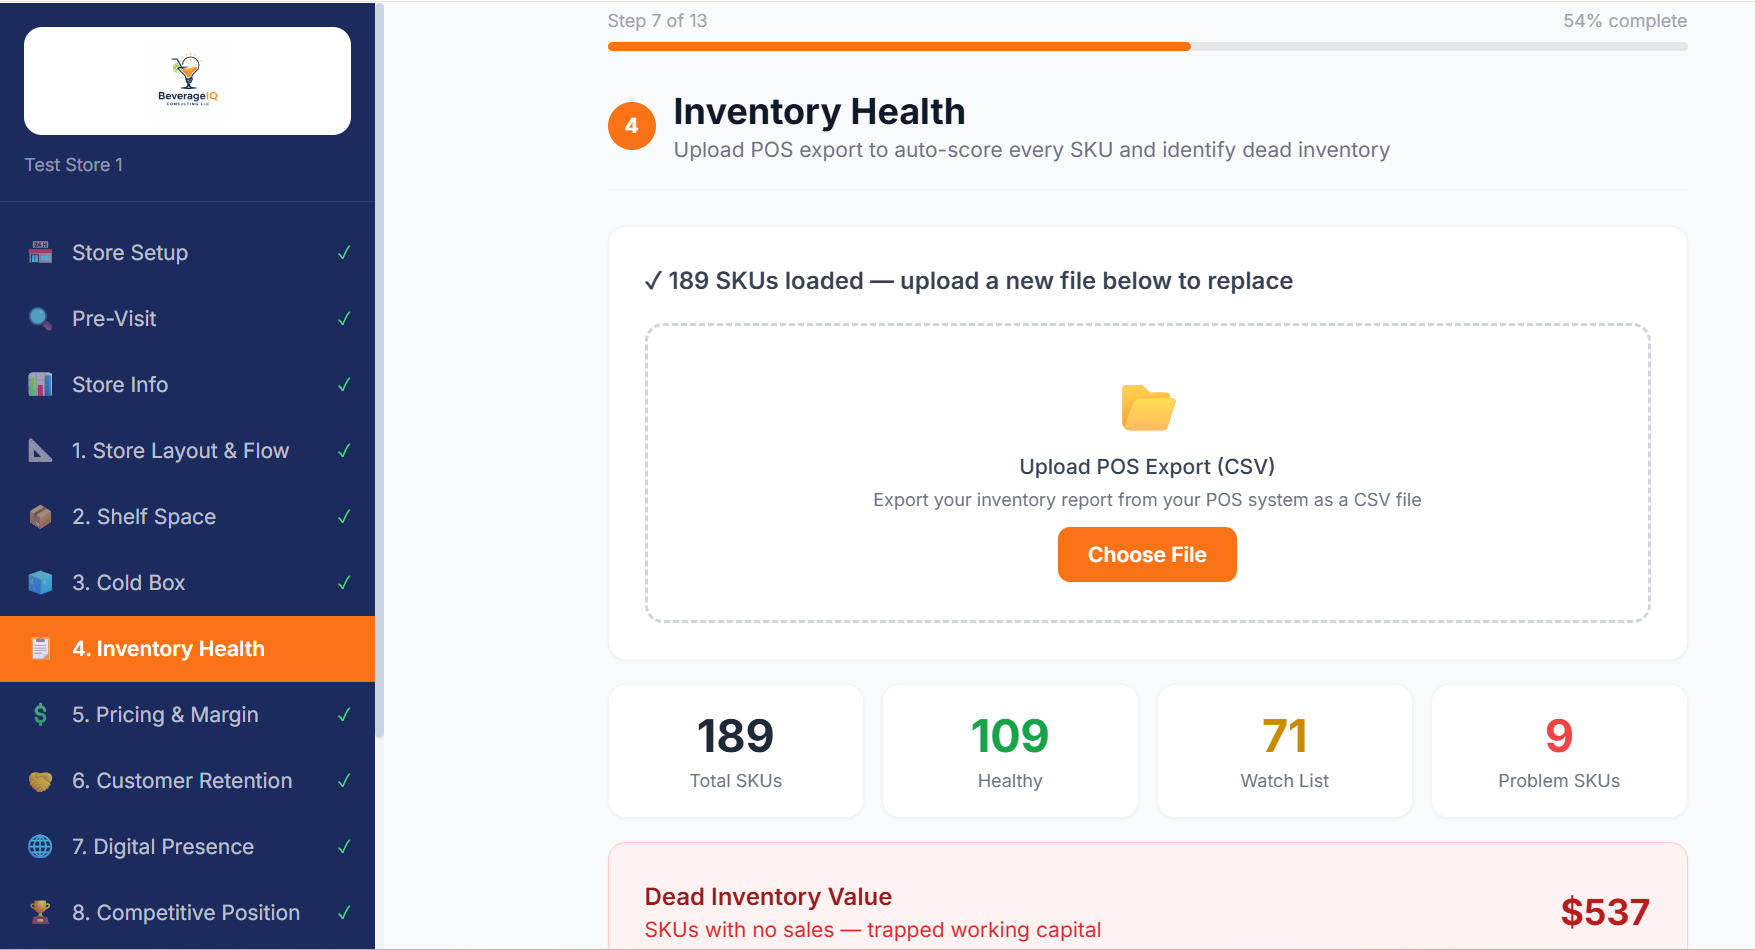
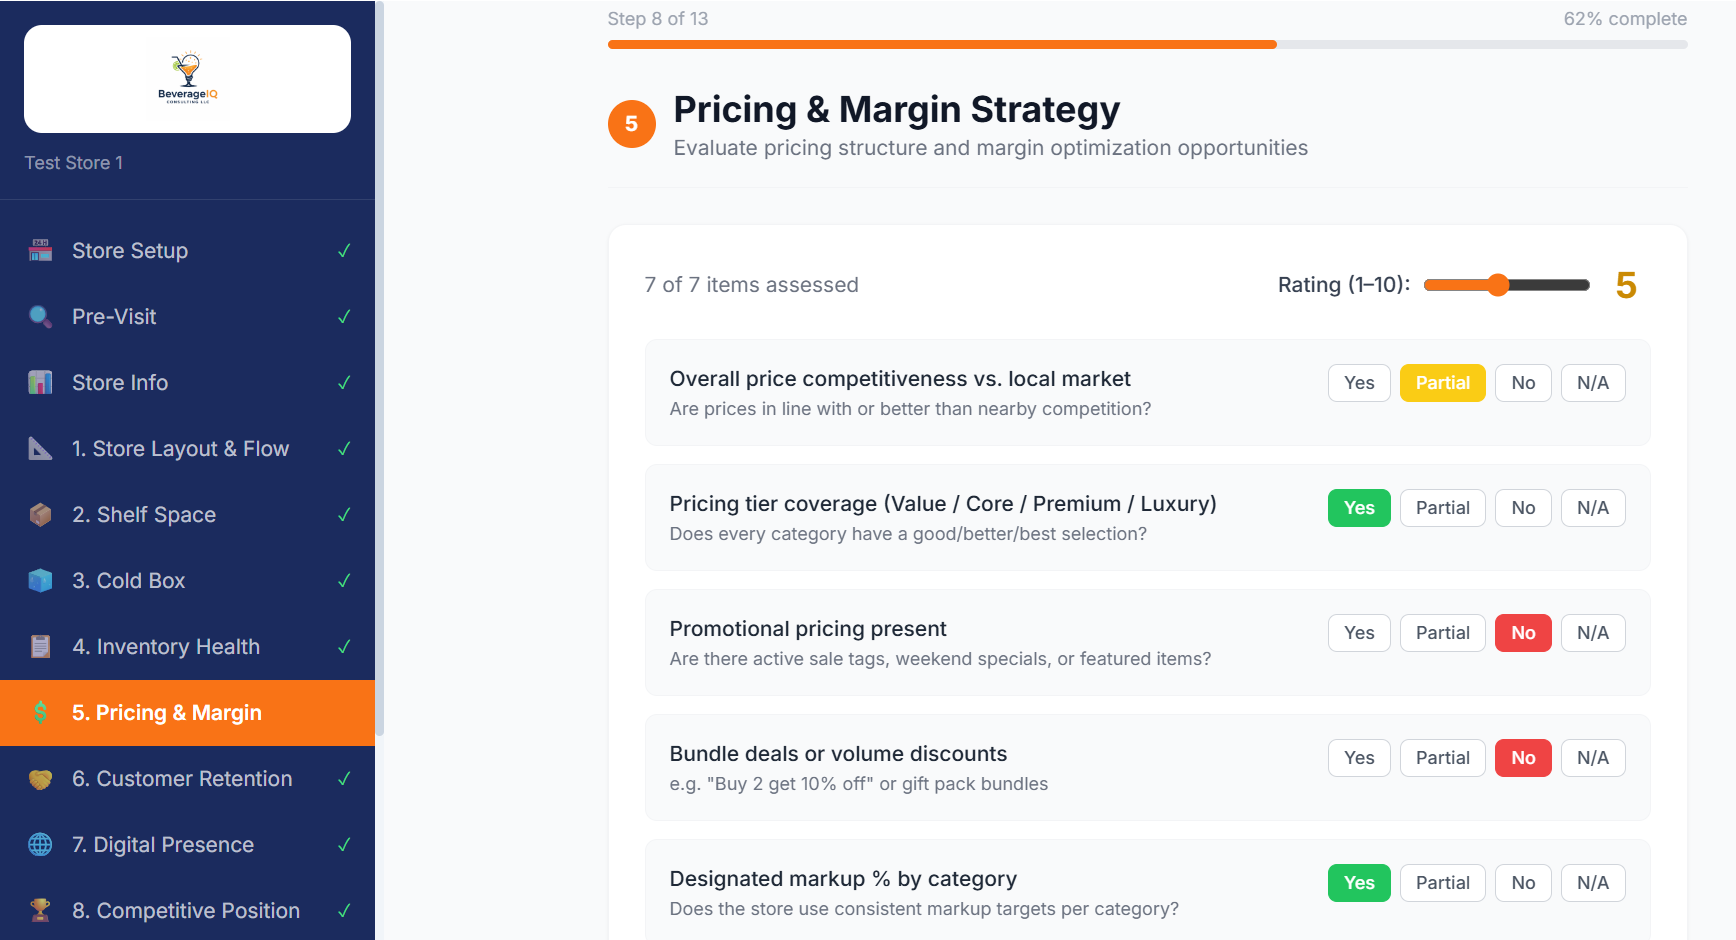
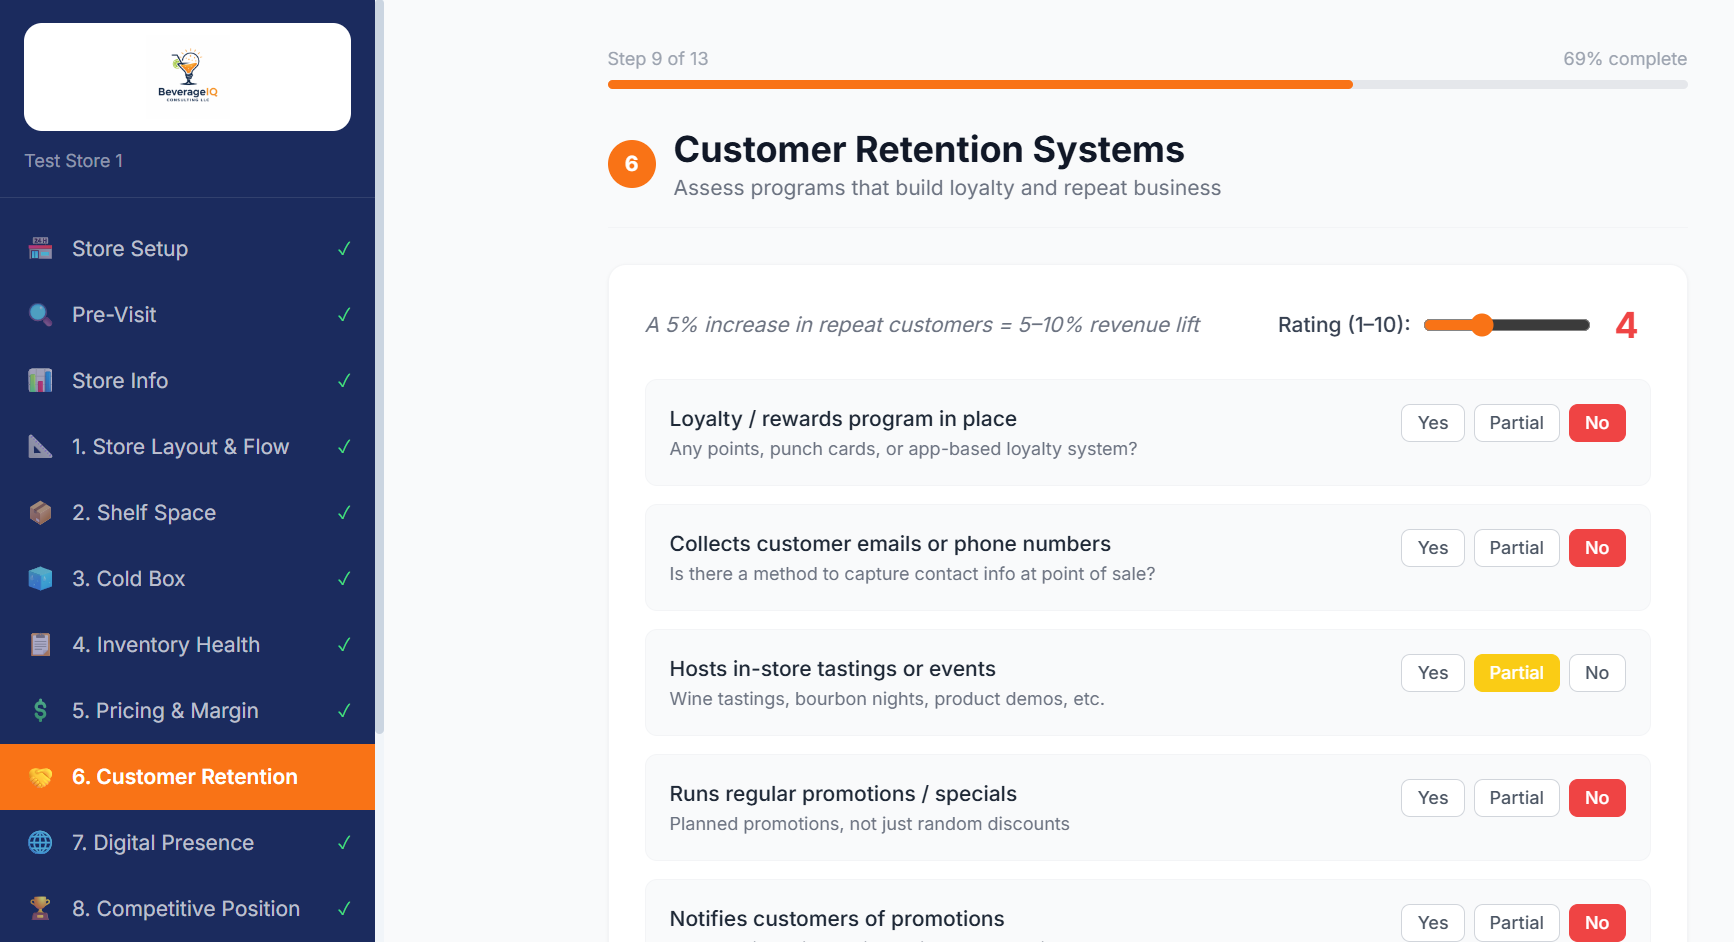
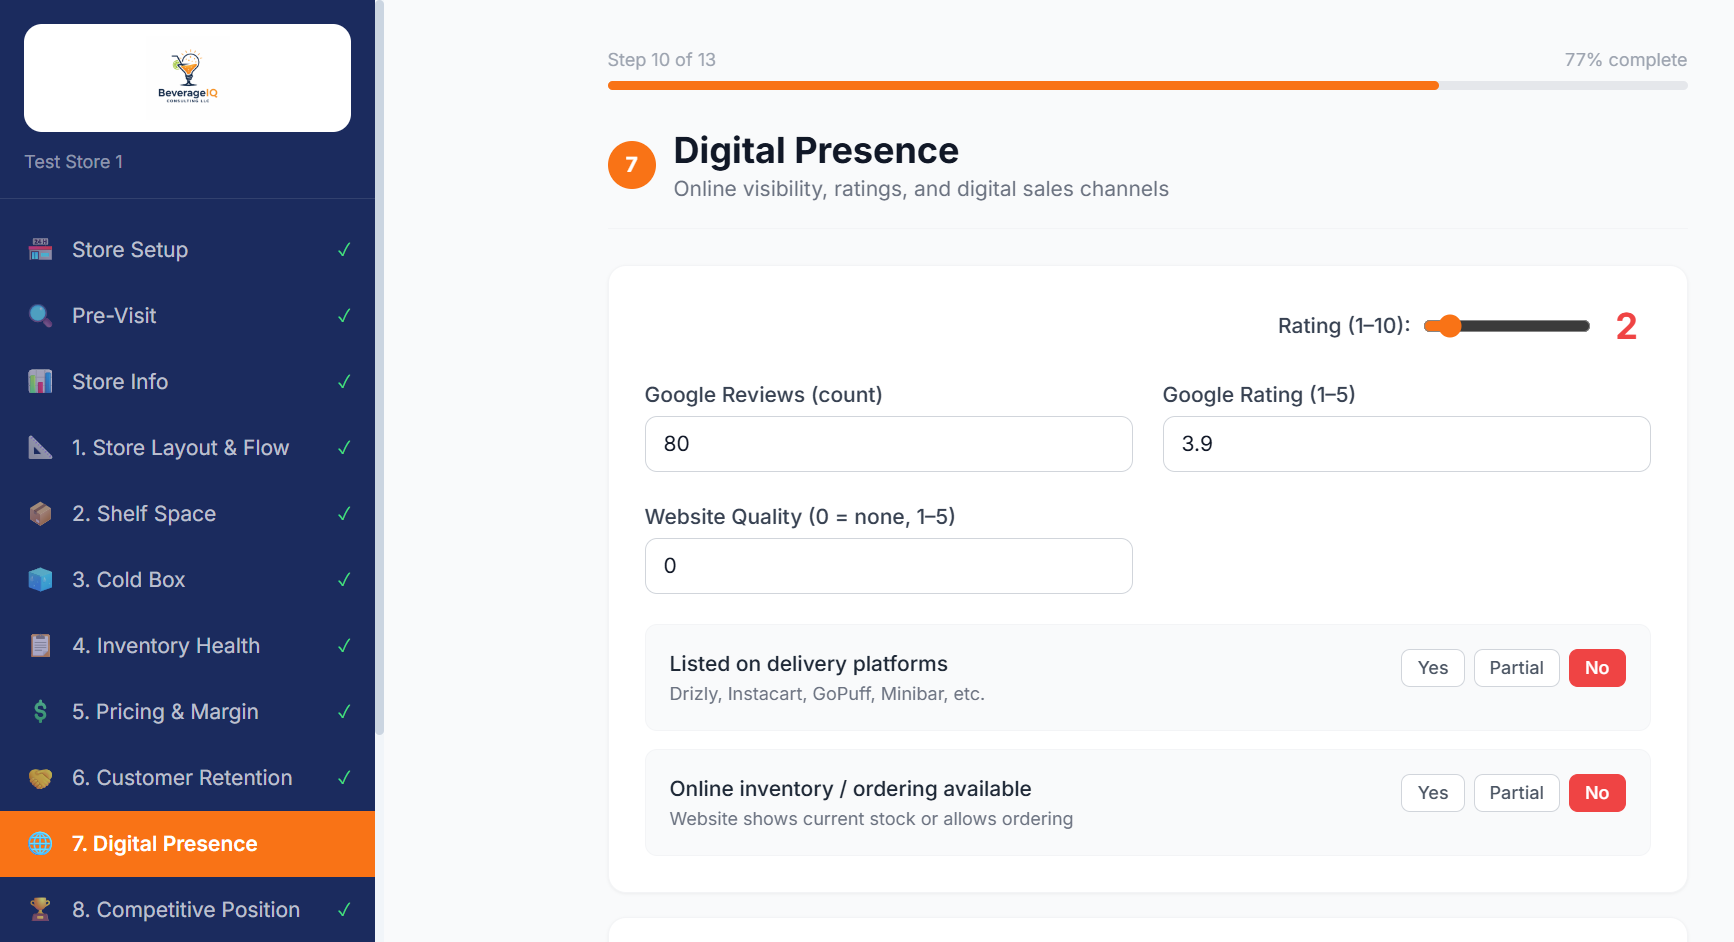
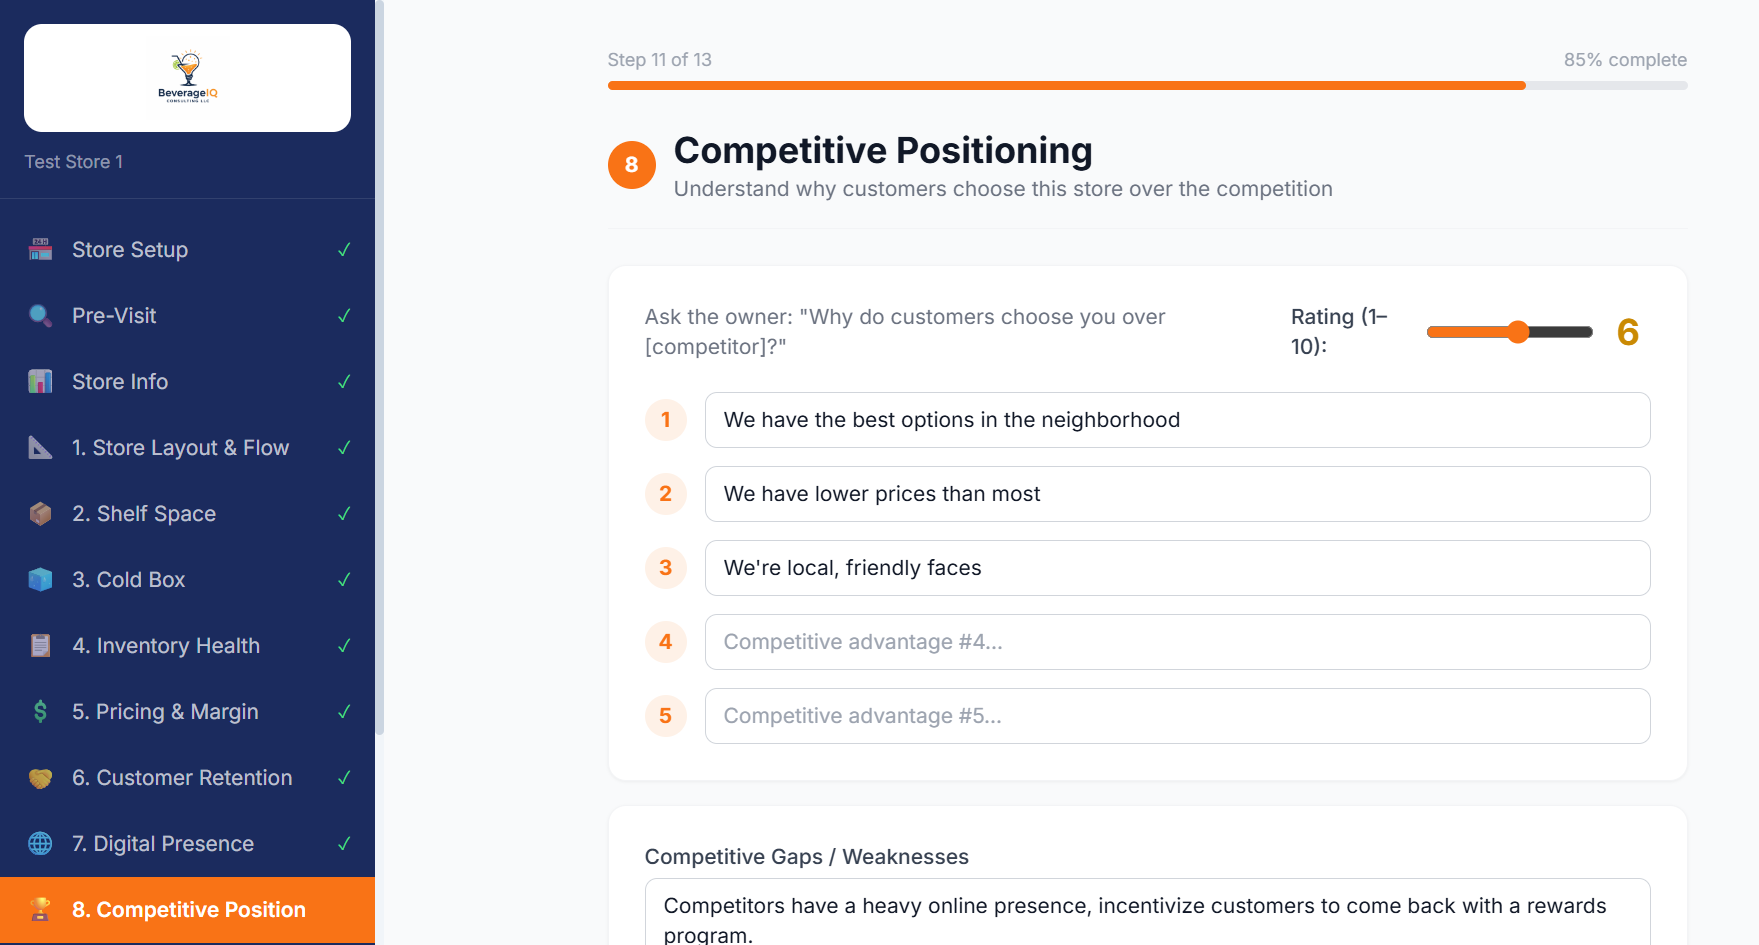
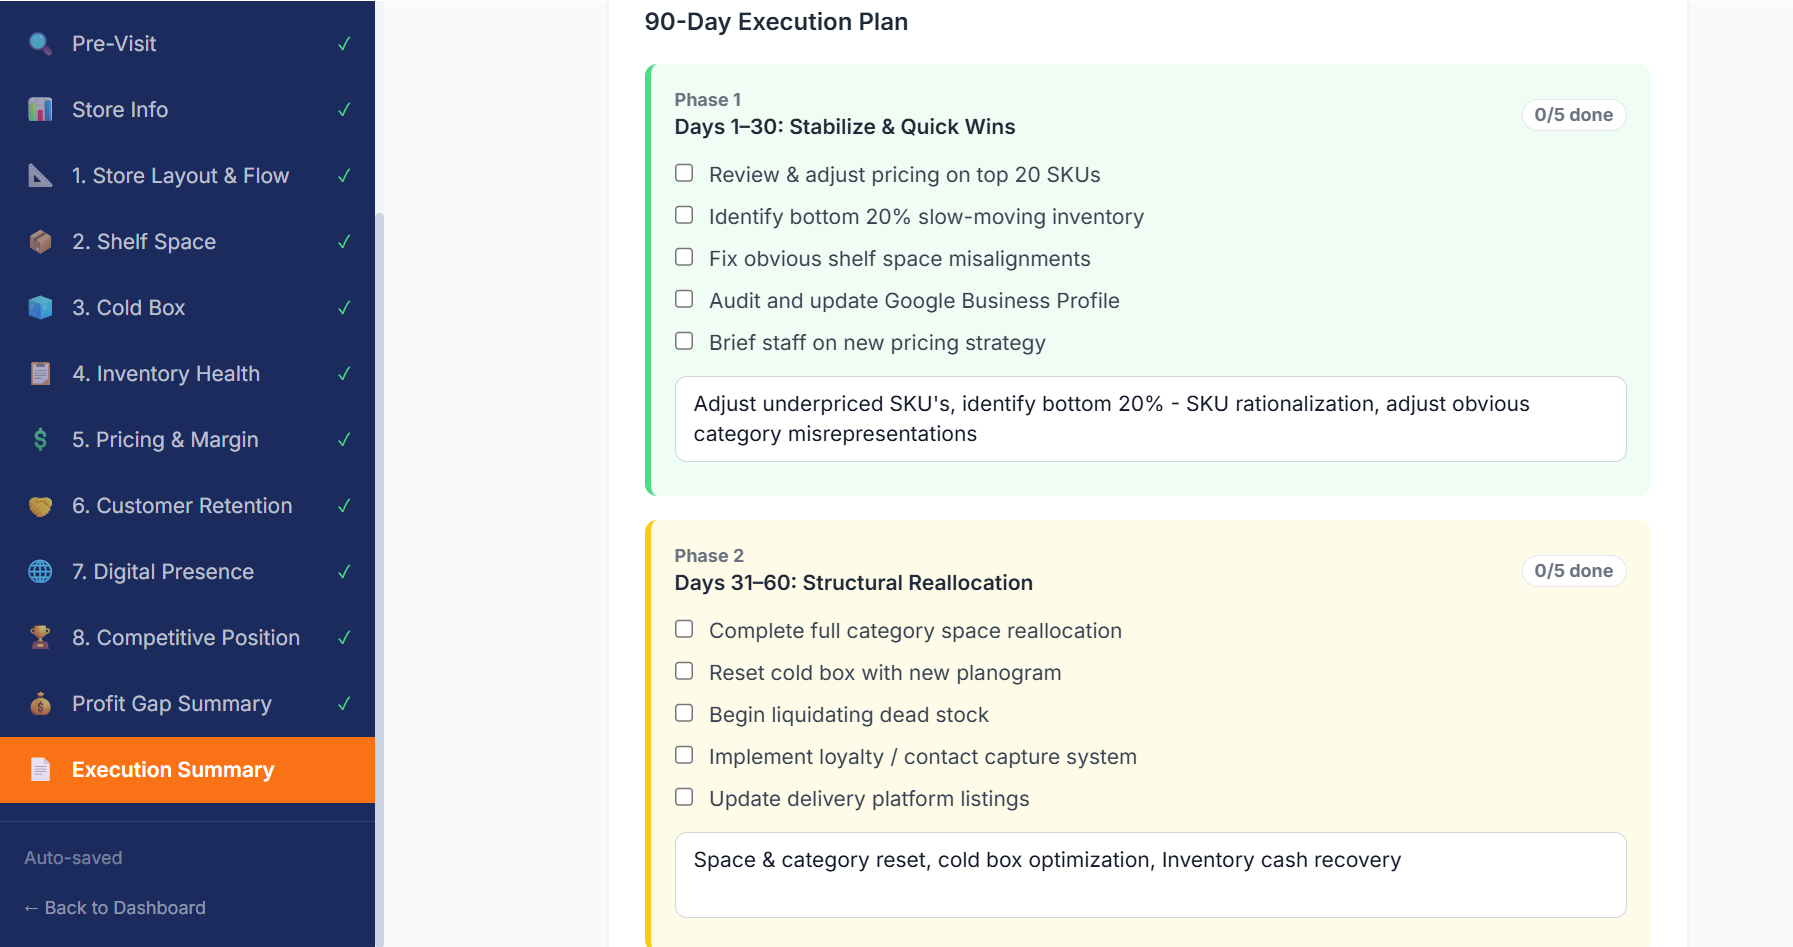
  • Guided 13-step audit process — nothing gets missed
  • Syncs across devices — start on a tablet, finish at your desk
  • Auto-saves in real time — no lost work
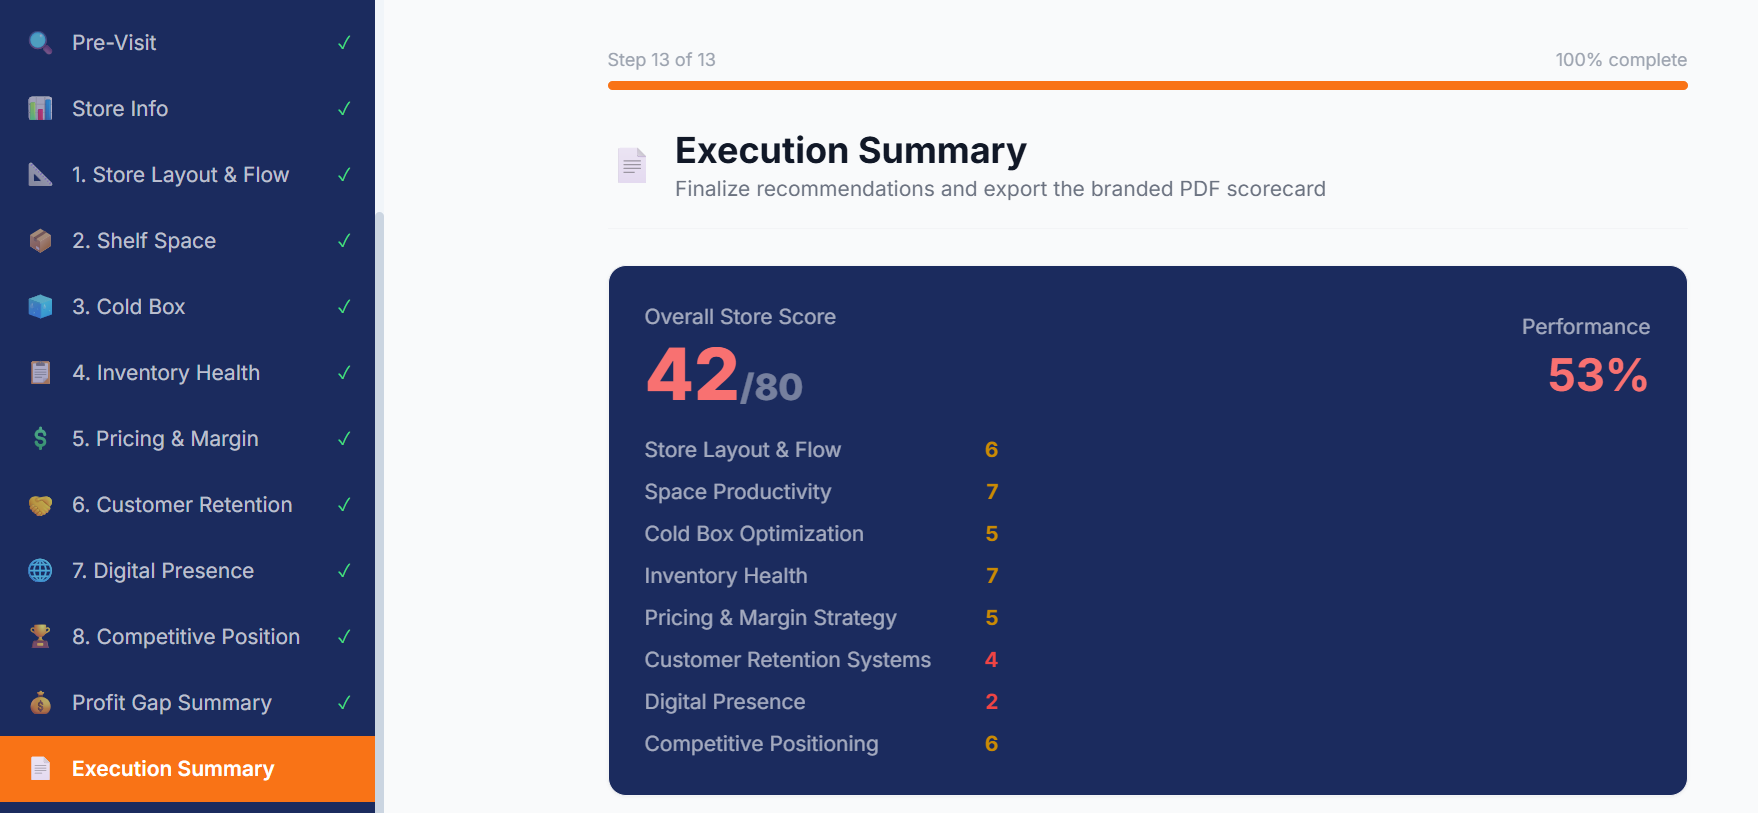
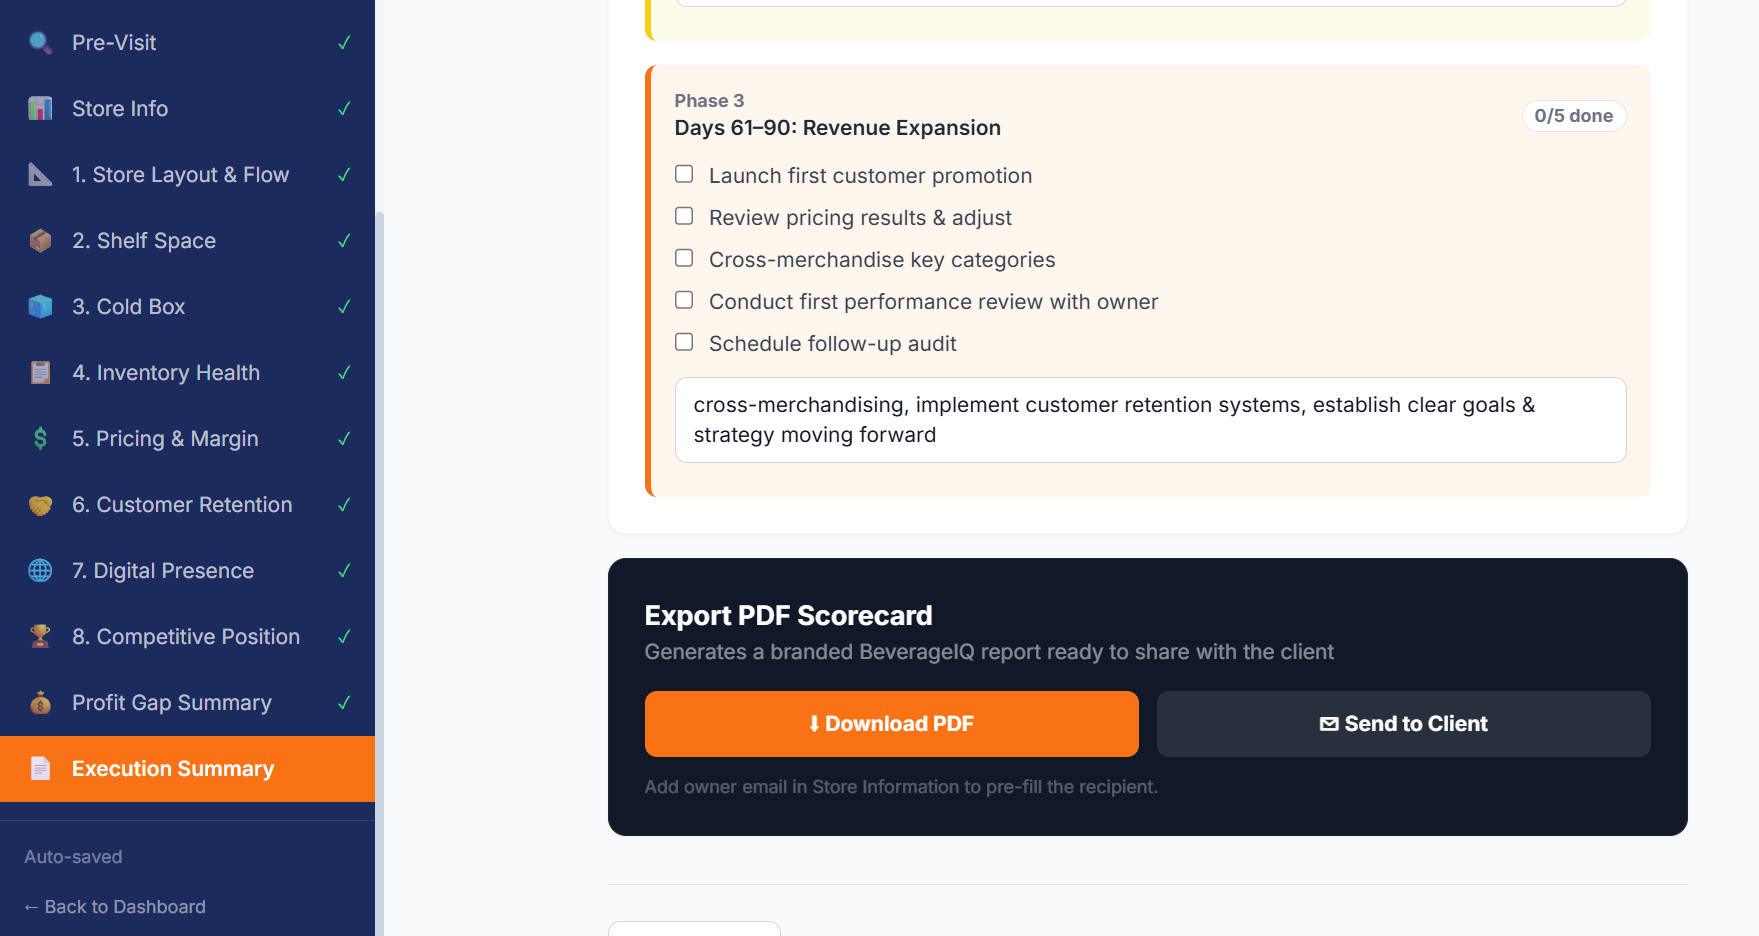
  • Generates a branded PDF scorecard for the client
  • Secure — each store owner sees only their own data
BeverageIQ Login
Section 1 of 8

Store Layout & Flow

We evaluate how well the store is organized — sight lines, end caps, signage, and premium placement.

Store Layout
Section 2 of 8

Shelf Space Analysis

We map every category's linear feet against its percentage of total sales. Tequila is 17% of revenue but gets 6% of space — that's money on the floor.

Shelf Space Analysis
Section 3 of 8

Cold Box Optimization

Beer and wine are consuming 80% of cooler space but generating proportionally less revenue. RTD, Vodka, and Tequila all need to Expand.

Cold Box Optimization
Section 4 of 8

Inventory Health

Upload a POS export and every SKU gets auto-scored. We identify what's healthy, what's a problem, and exactly how much cash is trapped in dead stock.

Inventory Health
Sections 5 & 6 of 8

Pricing, Margin & Customer Retention

We assess pricing structure and every retention system in the store. Most stores score low here — and it's where the fastest wins are.

Pricing & Margin Customer Retention
Sections 7 & 8 of 8

Digital Presence & Competitive Positioning

80 Google reviews, 3.9 stars, no website, not on any delivery platform. This store is invisible online while competitors are not.

Digital Presence Competitive Positioning
The Deliverable

Every Store Gets a Scored Report

At the end of the audit, you see an overall score, section-by-section ratings, and a complete performance snapshot.

Audit Scorecard
Key Findings

Top 5 Revenue Opportunities

We document the highest-impact actions for this store — prioritized, specific, and tied to real dollar estimates.

Top 5 Opportunities
Profit Gap Modeling

We Show Exactly What's Being Left on the Table

Interactive sliders model the revenue impact of each opportunity area based on this store's actual annual revenue.

Profit Gap Sliders Profit Gap Total
The Roadmap

90-Day Revenue Optimization Plan

Every audit ends with a structured, phase-by-phase checklist — not just findings, but exactly what to do and when.

90-Day Plan Phase 1 & 2 90-Day Plan Phase 3 & Export
Implementation

We Don't Just Identify Opportunities — We Execute Them

Following the audit, we offer hands-on implementation services to unlock the revenue identified.

📦

Shelf & Inventory Reset

Category reallocation, premium placement, SKU rationalization, and visibility improvements.

💵

Inventory Cash Recovery

Liquidate slow stock, free up working capital, and reinvest into high-turn products.

🧊

Cold Box Optimization

Reallocate cooler space to high-velocity categories and maximize high-margin convenience purchases.

🤝

Customer Retention Programs

Loyalty systems, contact capture, tasting events, and promotion calendars that bring customers back.

Investment

Straightforward, Performance-Driven Pricing

Start with the audit. Add implementation services as needed. Become a Growth Partner for ongoing results.

Profitability Audit

Starting at
$1,500
  • Full 8-section on-site audit
  • Branded PDF scorecard
  • Top 5 revenue opportunities
  • 90-day action plan
  • Profit gap dollar modeling

90-Day Optimization Program

$8,500 – $27,500
  • Phase 1: Stabilize & Quick Wins
  • Phase 2: Structural Reallocation
  • Phase 3: Revenue Expansion
  • Hands-on implementation
  • Full audit included
Growth Partner Program

One Partner Per Competitive Area

Ongoing advisory access, priority support, and first access to new initiatives — exclusive to stores that complete implementation.

🔒

Exclusivity

We work with one store per competitive trade area. Your competitors won't have access to the same strategies.

📞

Ongoing Advisory Access

Monthly check-ins, ongoing data review, and direct access to your consultant as your business grows.

🚀

First Access to New Tools

Growth Partners are first to access new audit features, benchmarking data, and market initiatives.

BeverageIQ

Ready to Find Your
Hidden Revenue?

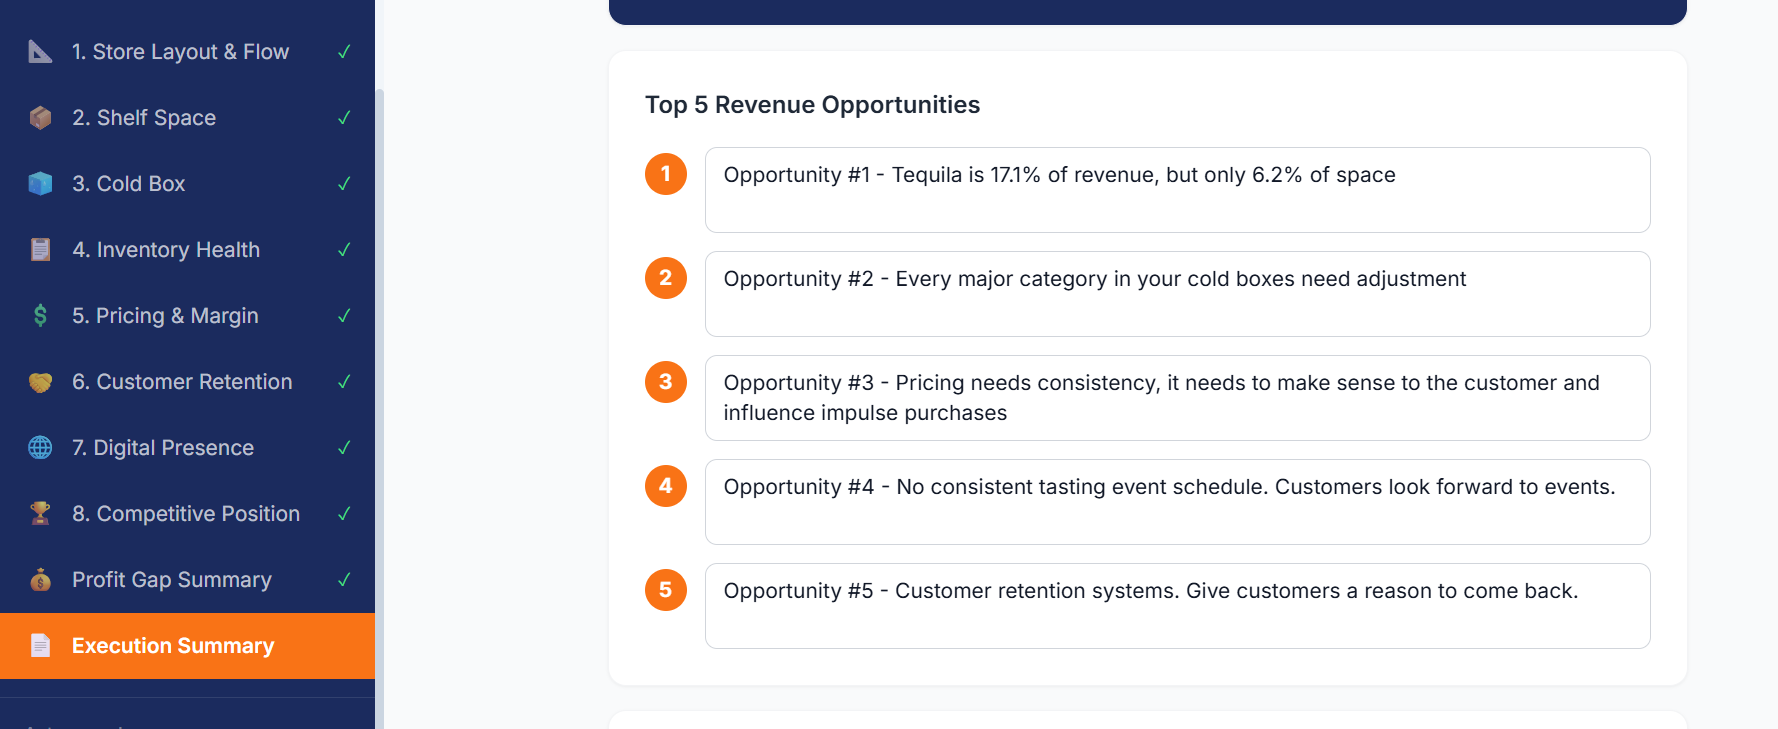
Begin with the Profitability Audit. Most stores identify 6–18% in untapped revenue within the first visit.

Book a Free Discovery Call
Jacob Wyrick
jacob@BeverageIQconsulting.com
BeverageIQconsulting.com
813-694-3311
Tampa, FL
ELEVATE YOUR BUSINESS
1 / 19